


Motivation
Visual NLP is an advanced tool built on top of the Apache Spark processing engine, designed to handle Visual Document Understanding (VDU) tasks, including Visual Information Extraction. The library already contains models and pipelines for Visual Entity Extraction, that is, finding entities in documents according to visual clues. These entities include things like keys and values in forms, or the total amount charged in an invoice. The next natural processing stage after Visual Entity Extraction is the linking of the entities to extract hierarchies between the entities. These hierarchies typically represent structures like forms or tables. In this article we are presenting an end-to-end model for Form Extraction.
The model we are presenting is capable of extracting forms by detecting keys and values in the document and their connections, a.k.a linking, without doing post-processing or analyzing the coordinates of the keys and values in a separate stage, which results in lower processing times, while at the same time we try to achieve the best metrics on the market, comparing ourselves with commercial solutions such as: Google AI, AWS textract, and Azure.
In the following sections, we will first discuss the form extraction task, providing an overview of what it involves. Next, we will introduce the datasets, models, and metrics used in our evaluation. With this foundational knowledge in place, we will present the benchmark for form extraction, analyze the evaluation results, and show visual examples from different models. This will allow us to demonstrate that the models we’ve presented are among the best in their class. Let’s jump right in!
Form Extraction
In this section, we explain form extraction from a conceptual standpoint. First let’s consider the natural question: What is a form? A form is a data structure. This data structure defines data elements, and their relationships. Let’s look into this with a graphical example:
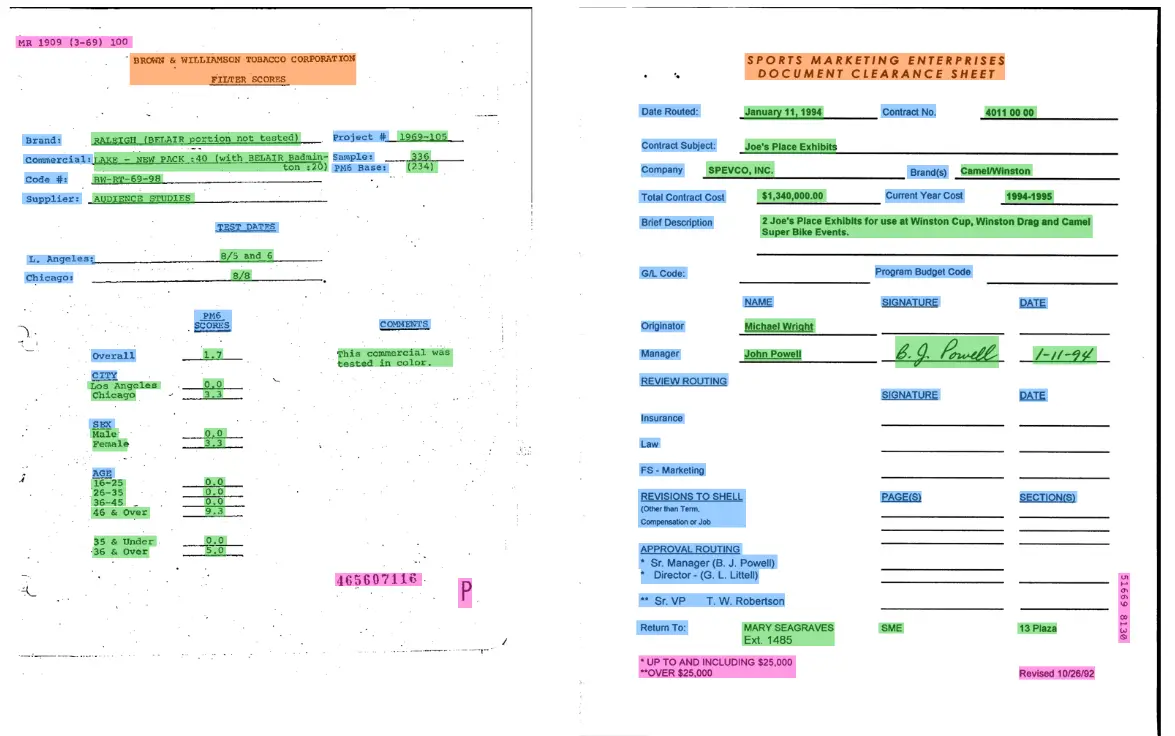
Figure 1. Word grouping and semantic entity labeling example [1]
Then, the relationships are the connections between these entities. Typically these data structures are pretty shallow without too much nesting. In general there is not a general pattern for the relationships, sometimes a pair of connected entities can be one next to each other, one below another, or can also present some other type of graphical relationship. Also, the information that comprises the form can be interleaved or mixed with other auxiliary texts like explanations about the form itself.
The key promise in Form Extraction is that these data structures can be created from unstructured documents, and are capable of representing the information in a non-ambiguous way.
Datasets of Comparative Analysis of In-House and Cloud-Based Form Extraction Models
To compare Visual NLP’s models against other players, we will be using 2 datasets: FUNSD and Genetic Reports 0.1. Let’s take a look at each of these datasets in more detail.
FUNSD
This dataset for Form Understanding in Noisy Scanned Documents (FUNSD) can be used for various tasks, including Text Detection, Optical Character Recognition, Spatial Layout Analysis and entity labeling/linking.
All the annotations are encoded in a JSON file. An example showing the annotations for the image below is presented. A detailed description of each entry from the JSON file is provided in the original paper “G. Jaume, et al. (2019). FUNSD: A Dataset for Form Understanding in Noisy Scanned Documents. Arxiv, 6”.
The dataset includes 199 scanned and fully annotated forms, 149 for training and 50 for testing.
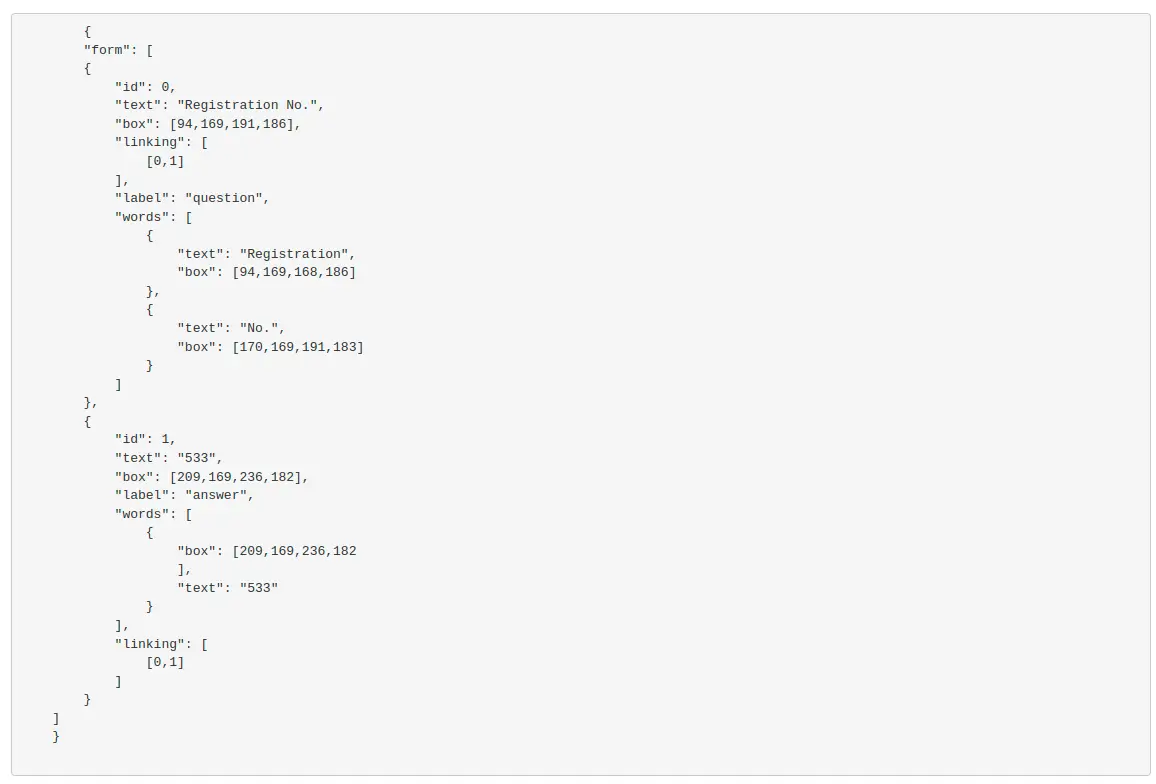
Figure 2. Dataset format example. [1]
Genetic Reports 0.1
We have created this dataset consisting of 67 document images, annotated with entity labeling/linking, specifically designed for Form Extraction using key-value pairs. The documents are from the medical domain, and the link structure of the key-value pairs goes from headers to question and from question to answers.
Here is an example of a document in this dataset:
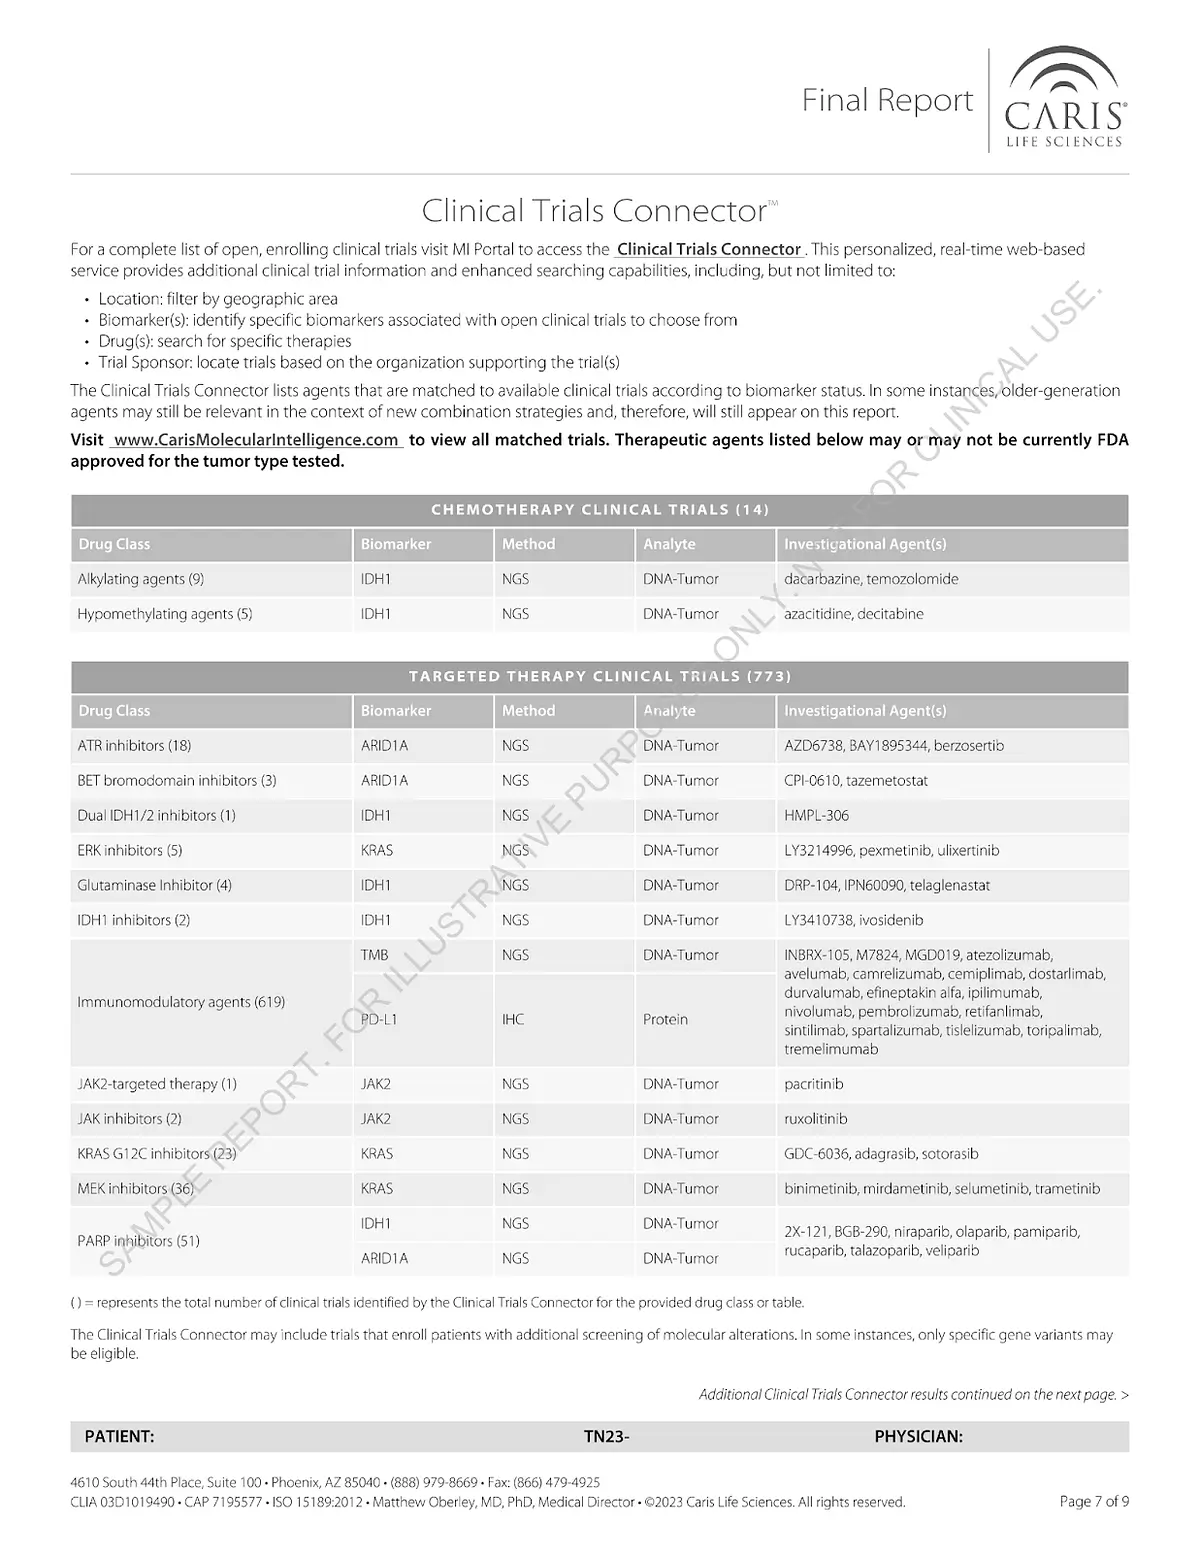
Figure 3. Genetic Report Dataset example
Metrics
We utilized the classical standard metrics to evaluate the algorithm’s performance, which list we list here in case you need a refresher,
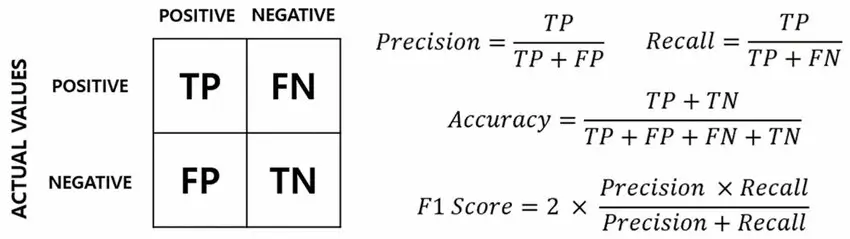
- Precision. Measures how accurate the identified key values are, indicating the proportion of correctly identified values out of all values identified.
- Recall. Measures the ability of the algorithm to capture all relevant key values by comparing true positives to the total number of true key values.
- Accuracy. Overall effectiveness by showing the proportion of correctly identified key values out of the total evaluated.
- F1 Score. Balances precision and recall, offering a single metric that reflects both accuracy and completeness.
The following image illustrates how different metrics are calculated, starting from the confusion matrix, which displays the results obtained by comparing the predicted key values against the ground truth. The confusion matrix provides a detailed breakdown of true positives (TP), true negatives (TN), false positives (FP), and false negatives (FN). By analyzing the confusion matrix, we gain insights into the strengths and weaknesses of the algorithm in accurately extracting key values.
The main difference between the evaluation of this task here compared to the evaluation done in many research papers is that here we don’t perform a 2-step computation of metrics, one for Entity Extraction, and another one for Entity Linking. Instead, what we do is to convert the extracted form to a shallow JSON representation, and then compute Precision and Recall over the JSON keys and values.
These metrics are computed by comparing the key values generated by the algorithm against the ground truth values, allowing for a comprehensive assessment of the system’s performance in information extraction tasks.
We developed a Python notebook to automate the calculation of Precision, Recall, and F1-Score metrics using a detailed algorithm. The notebook processes the key-value pairs extracted from forms by different models and compares them against the ground truth values for accuracy. The code accomplishes this by loading the model’s output and the corresponding ground truth, then normalizing the data by converting all text to lowercase to ensure consistency.
The comparison between the predicted and ground truth values is done using a Levenshtein distance-based method, which accounts for minor differences like OCR errors. In this way, results containing slightly different keys are penalized, but not discarded entirely. The code evaluates each key-value pair, classifying them as True Positives (TP), False Positives (FP), or False Negatives (FN) based on their matching accuracy and computes the metrics accordingly. Finally, the notebook calculates the average Precision, Recall, and F1-Score from all the evaluation dataset files.
Models
In our Visual Document Understanding benchmark study, we evaluated several models for form extraction, including:
In-house small vLLM: Our custom model is a multi-modal framework designed for Visual Document Understanding, seamlessly integrating both Entity Recognition and Relation Extraction. Initially, the model was pre-trained on multiple datasets including FUNSD. Later, the model was fine-tuned on other custom datasets to further improve its precision in specific tasks. This tailored approach allows the model to excel in extracting and understanding complex visual and textual information from documents.
- In-house small vLLM v1: Utilized as the initial model for evaluation, it was pre-trained on multiple datasets including FUNSD.
- In-house small vLLM v2: In-house small vLLM v1 model adapted to handle specific characteristics of the custom Genetic Reports 0.1 dataset.
- In-house small vLLM v3: In-house small vLLM v1 model adapted to handle specific characteristics of the Genetic Reports 0.1 and FUNSD datasets.
Cloud Provider AI Models: We also analyze results from major cloud providers like: Google Cloud Document AI, Amazon Textract, and Azure Form Recognizer. These models are designed to handle either table data or form extraction individually. To effectively compare them with our In-house small vLLM models, which performs both tasks simultaneously, we combined the outputs of the separate models for tables and forms. We provide all processing scripts and instructions on how to perform these post-processing in our Python notebooks. This approach allows us to evaluate the performance of the cloud providers’ solutions in a manner comparable to our In-house small vLLM models.
Evaluation
The evaluation of the models was conducted by calculating key metrics such as precision, recall, and F1-score, using a custom Python notebook. This process involved comparing the key values extracted from forms and tables by the models against the ground truth data. The following steps outline the evaluation process:
- Data Preparation: Both the predicted results (from the models) and the ground truth data were stored in JSON format. The evaluation script reads these JSON files, ensuring that all keys and values are normalized (e.g., converted to lowercase) to avoid discrepancies due to case sensitivity.
- Metric Calculation: The core of the evaluation is based on comparing the predicted key values to the ground truth to compute precision and recall metrics, explained before. To account for small errors like typos, the Levenshtein distance is used. A threshold is set to decide how much of a difference is allowed between the predicted and actual values. If the difference is small enough, it counts as a match, helping to handle minor mistakes while still giving a fair evaluation.
- Handling Cloud Provider Models: Since the cloud provider AI models (Google, Amazon, Azure) offer separate models for table extraction and key value extraction, we combined the outputs from both models for each document. This unified representation was then compared to the ground truth, allowing us to assess the performance of the cloud-based solutions in a manner comparable to our In-house small vLLM models, which handles both tasks within a single model.
- Computation of Final Scores: After processing all documents, the script calculates the average precision, recall, and F1-score across the entire dataset. These metrics provide a comprehensive measure of each model’s effectiveness in key value extraction.
- Error Handling and Reporting: The script also tracks files with missing or problematic results, reporting any issues encountered during the evaluation process. This ensures transparency and helps in identifying areas for potential improvement in the models or the evaluation process.
By following this methodology, we were able to rigorously compare the performance of the various models on the task of key value extraction, providing valuable insights into their strengths and weaknesses.
Evaluation in FUNSD
The table below presents the performance metrics (Precision, Recall, and F1-score) of various models evaluated on the FUNSD dataset. This dataset is challenging due to its diverse layout and text variations.
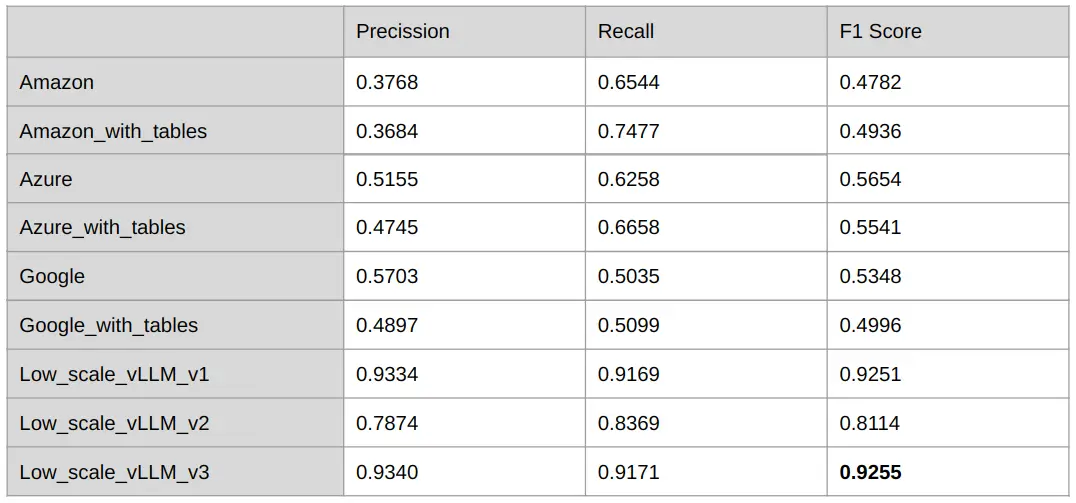
Table 1: Evaluation of the different models on FUNSD dataset
Comparing the results of cloud providers with and without table integration, we observe that including table information improves recall because less information is lost relative to the ground truth. However, precision decreases as more noise or incorrect information is introduced. For Google, the impact on recall is minimal, but there is a noticeable reduction in precision. In this dataset, we conclude that, given the limited number of tables, incorporating table processing algorithms generally results in worse F1 scores.
Besides, our in-house models consistently outperform the cloud providers in both precision and recall, leading to higher F1 scores. Among them, the “Low_scale_vLLM_v3” model stands out due to its diverse training, demonstrating superior performance in handling complex documents compared to the cloud alternatives. While cloud solutions offer versatility, they face challenges with specialized datasets like FUNSD, where our tailored models excel.
Evaluation in the custom Genetic Reports 0.1 dataset
The table below presents the performance metrics (Precision, Recall, and F1-score) of various models evaluated on the custom Genetic Reports 0.1 dataset.
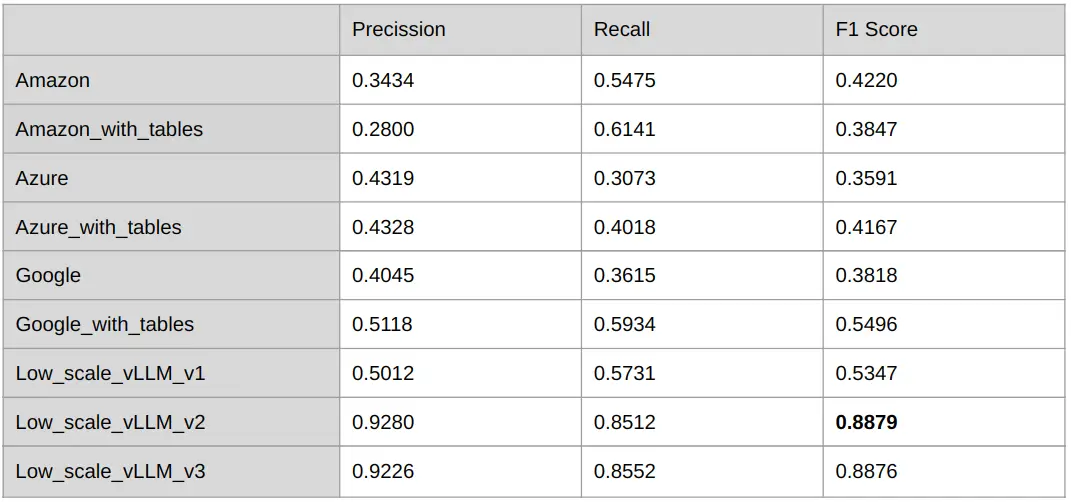
Table 2: Evaluation of the different models on the custom Genetic Reports 0.1 dataset
As in the previous dataset, comparing the results of cloud providers with and without table integration shows that recall improves while precision decreases. For Amazon Textract, this integration introduces more errors, leading to reduced overall performance. Azure Form Recognizer experiences modest gains, whereas Google Cloud Document AI benefits the most, with significant improvements across all metrics when table data is included. In this dataset, which includes more and complex tables, incorporating table processing algorithms generally results in better F1 scores.
Additionally, our in-house small vLLM models, particularly those fine-tuned on this dataset (v2 and v3), consistently outperform all cloud providers, even when these models include table data. The “Low_scale_vLLM_v2” model achieves the best results on the custom Genetic Reports 0.1 dataset, closely followed by the “Low_scale_vLLM_v3” model. These trained models demonstrate the ability to handle various document structures and content types with near-perfect accuracy.
Experimental Analysis
In this section, we’ll present several examples to demonstrate how different models handle form extraction, where each result is represented by a key-value pair (e.g., Name (key) — Peter (value)). We will explore specific cases where models demonstrate varying levels of precision, influenced by factors such as the inclusion of redundant data or the complexity of the ground truth. These examples will highlight the strengths and weaknesses of each model, particularly in their ability to manage both simple and complex form pairs, as well as their performance when dealing with lengthy textual elements within documents.
To provide a clear comparison, we randomly selected five images from the Genetic Reports 0.1 dataset, showcasing the results obtained in each case. The objective is to illustrate how the metrics discussed earlier can fluctuate based on different scenarios. The models analyzed include various cloud providers that incorporate table analysis, as well as our in-house model, vLLM v1, offering a comprehensive evaluation of their performance across diverse document types.
The results will be displayed as a list of form pairs, with each pair represented by a different color in JSON format. Any results not highlighted with a color indicate severe reading errors that reduce the model’s precision or introduce extra noise, which could lower the model’s recall. The ground truth column will include all the different types of form pairs that are intended to be detected, each with its respective color. If any of these colors do not appear in the other columns, it indicates a reading error and the loss of a form pair, leading to a decrease in the model’s precision.
It is important to note that for evaluation, it is necessary to match the form pairs from the ground truth with those in the results to make a meaningful comparison and evaluation. If the key is significantly different, the score for that instance will be 0. Additionally, when comparing at the OCR level as previously explained, if the text is very different, the score will be very low. If a key-value pair with a large amount of text is lost, the score loss will be even more significant.
- Result of pretrained models and ground truth in the image of the custom Genetic Reports 0.1 dataset called: “Caris-Molecular-Intelligence_MI-Profile_Breast_NOS_WEBchanged_0”.
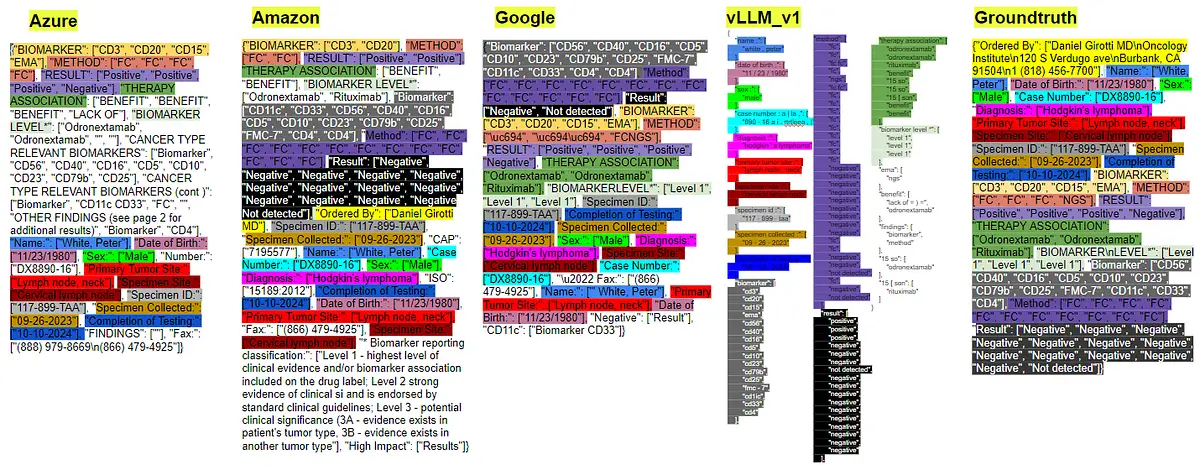
Models like Azure and Amazon exhibit the inclusion of more noise compared to others, leading to lower precision in their results. Shorter key values, which can be considered straightforward (e.g., “Name,” “Gender,” “Diagnosis,” etc.), are accurately detected by all algorithms. However, there are cases like “Ordered by,” where the ground truth could also be valid with much less text, similar to the output provided by other models. In this instance, “Ordered by” is detected only by Amazon, while Azure fails to find other keys like “Case number” and “Diagnosis.”
Additionally, more complex keys such as “Therapy association” and “Biomarker level” are not correctly detected by either Azure or Google. As a result, only the key is highlighted without the associated values, reflecting a significant gap in their extraction performance. Despite these shortcomings, Google’s output is the best in this particular scenario, followed closely by the performance of our in-house vLLM model.
- Result of pretrained models and ground truth in the image of the custom Genetic Reports 0.1 dataset called: “CarisReport_2023_NSCLC_KRAS_G12C_PD-L1-unlocked_13”.
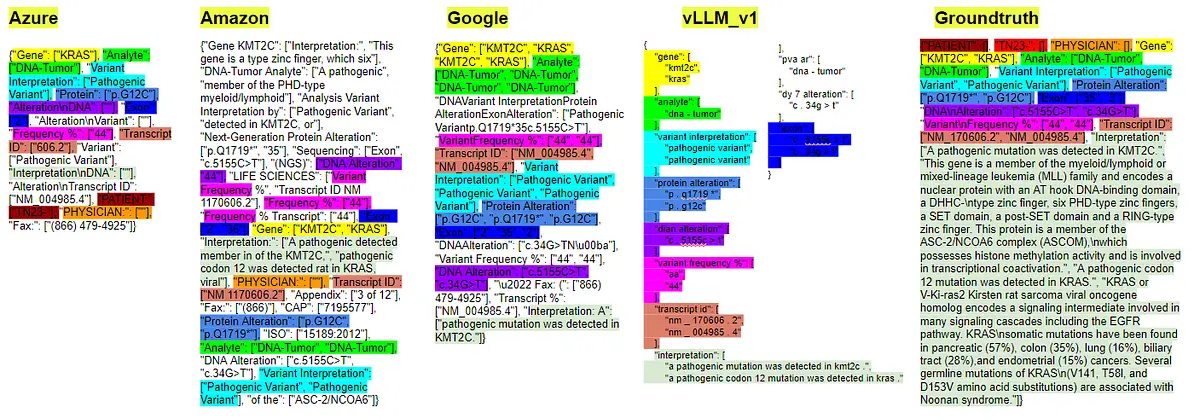
In some cases, such as with “Variant Frequency” and “Frequency” in Amazon, the same result is included twice in different forms, which diminishes precision. Large elements in the ground truth, like the term “Interpretation,” also significantly impact metrics due to their length. Such factors lead to domain-specific models performing better in these scenarios. Our In-house small vLLM model shows exceptional performance, with a Precision of 0.8315 and a Recall of 0.8456. This is notably higher compared to Google’s Precision of 0.5388, despite Google having a similar Recall of 0.8260, indicating in this case its superior ability to correctly identify and extract key values, even in complex documents with lengthy text elements.
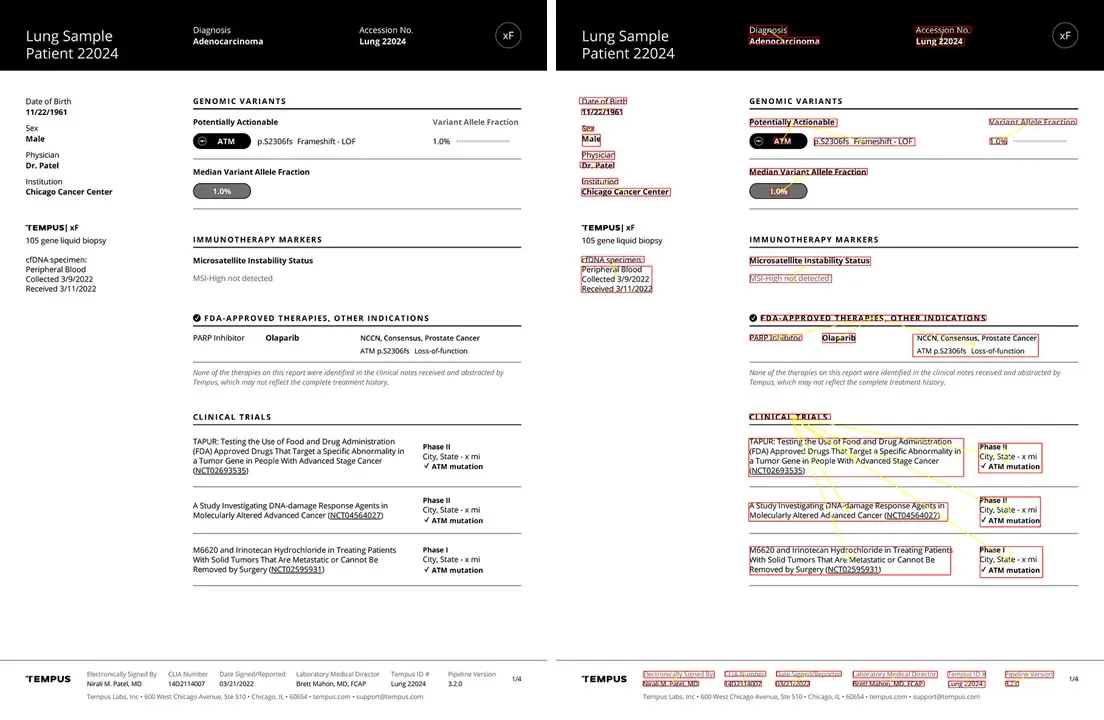
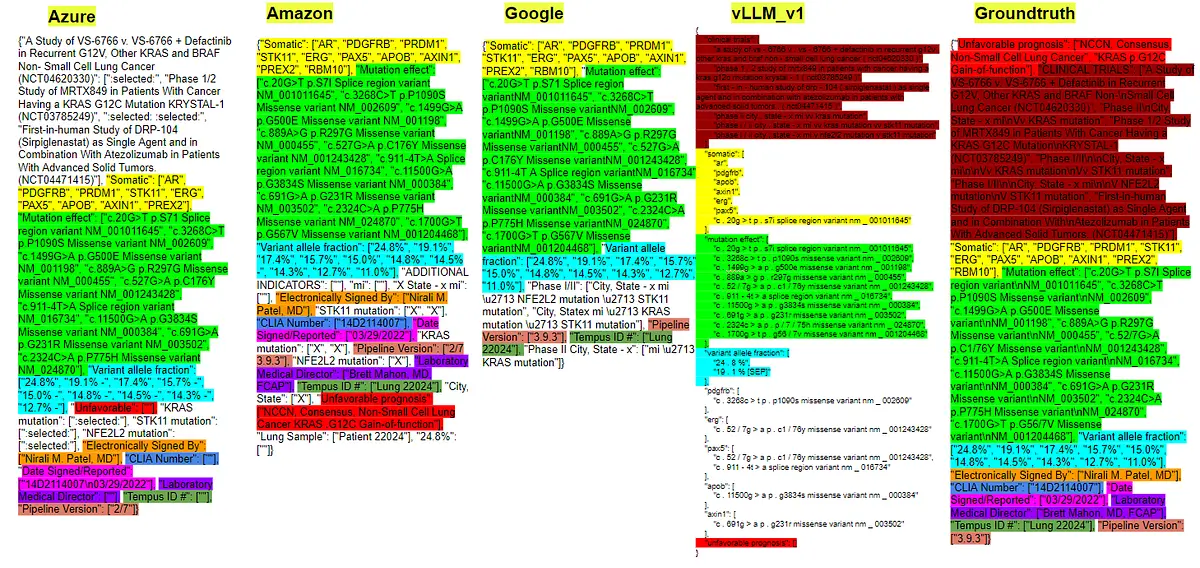
- Result of pretrained models and ground truth in the image of the custom Genetic Reports 0.1 dataset called: “Tempus-Onco_Clinical-Report-Sample_2”.
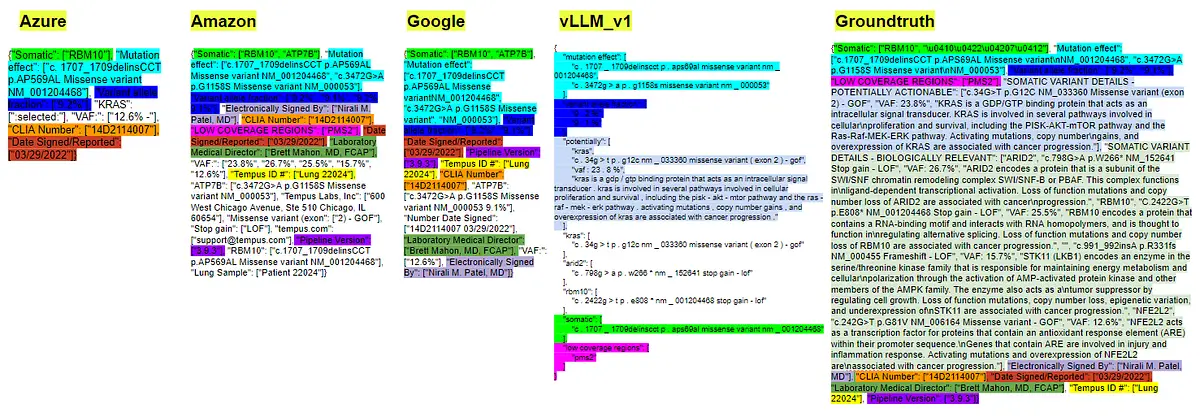
In this example, none of the models detect two key-value pairs from the ground truth well: “SOMATIC VARIANT DETAILS — POTENTIALLY ACTIONABLE” and “SOMATIC VARIANT DETAILS — BIOLOGICALLY RELEVANT,” which significantly impacts the accuracy metrics. While Amazon and Google capture shorter key-value pairs more accurately (Google with a Precision of 0.7487 and Recall of 0.7487, and Amazon with a Precision of 0.5431 and Recall of 0.8262), both Azure and our In-house small vLLM model show lower recall (Azure has a Recall of 0.2655, and vLLM_v1 has a Recall of 0.2433). This low recall indicates that these models miss many key-value pairs, resulting in lower performance for this particular case.
- Result of pretrained models and ground truth in the image of the custom Genetic Reports 0.1 dataset called: “oncoextra-tnbc-ntrk-wm-sample-report_8”.
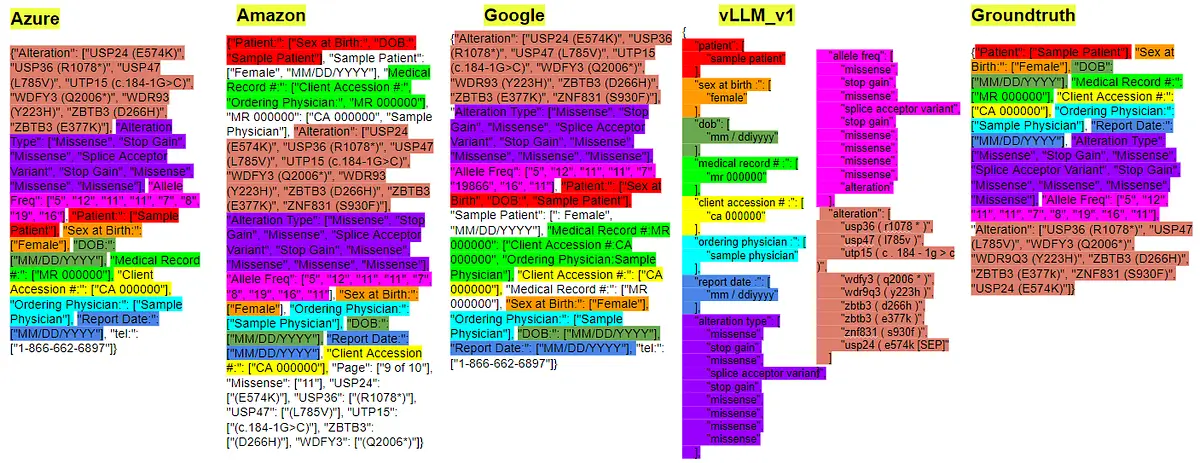 In this example, which features a simpler table structure, it is evident that the results from all models can be considered good. However, the precision of the output from the pre-trained In-house small vLLM and Azure models stands out. Specifically, the In-house small vLLM model achieves Precision and Recall close to 1.0, while Azure shows a bit lower Precision and Recall. These models accurately identify and extract key-value pairs with minimal noise or redundancy, demonstrating their effectiveness in handling documents with forms and tables and maintaining high accuracy in form extraction. Amazon and Google also perform well, with Amazon achieving a Precision of 0.4373 and Recall of 0.8872, and Google showing a Precision of 0.8043 and Recall of 0.8972, though their results are not as high as those of the two previous models.
- Result of pretrained models and ground truth in the image of the custom Genetic Reports 0.1 dataset called: “Tempus-Onco_Clinical-Report-Sample_1”.
In this case, all models effectively detect tables, as evidenced by the results from cloud providers that include table integration. However, the results for the vLLM v1 model are significantly lower, with a Precision of 0.2138 and a Recall of 0.1848, compared to other models such as Amazon (Precision: 0.5154, Recall: 0.9054), Azure (Precision: 0.5043, Recall: 0.6705), and Google (Precision: 0.7121, Recall: 0.4519). This lower performance is due to the loss of several key-value pairs. The improvements made in subsequent versions v2 and v3, which were trained with additional data, are evident, as these versions achieve results that surpass those of cloud providers in these scenarios.
In conclusion, we have examined a variety of examples from the evaluation dataset used for Genetic Reports 0.1. These examples reveal both strong and weak performance from each model. However, as shown in the evaluation table from the previous section, which displays the average results, Google and vLLM emerge as the top-performing models among the four. By incorporating the dataset into the base vLLM1 model, and subsequently developing models v2 and v3, we achieved significantly improved results. This demonstrates the effectiveness of adapting our model to various datasets, resulting in enhanced precision and recall.
Summary
In this article, we have thoroughly explored various solutions for form extraction, focusing on a comparative analysis of in-house and cloud-based form extraction models and approaches. We evaluated the performance of several cloud provider solutions alongside our custom model, analyzing key metrics such as Precision, Recall, and F1-Score.
The custom Python notebook created for this analysis allowed us to evaluate different datasets and models consistently and fairly. While cloud-based models demonstrated competitive performance, they often introduced noise and inconsistencies, particularly with complex document structures like tables in the custom Genetic Reports 0.1 dataset. In contrast, our models, designed with a multi-modal framework for Visual Information Extraction, consistently achieved higher accuracy, especially in detecting intricate key-value pairs after fine-tuning on custom datasets.
In conclusion, training our models on specific datasets significantly enhances their performance on those datasets while maintaining strong results across other datasets. This approach, using specialized models tailored to each dataset, proves to be an ideal solution for achieving exceptional document processing.
Resources
The following outlines the essential steps and resources required to replicate the results presented in this work: