HackPrinceton is Princeton University’s premier 36-hour hackathon which brings together 500 developers and designers from across the country to create incredible software and hardware projects.
At HackPrinceton, fellow hackers come with or without a team or an idea, but all of them go out at the end with an incredible and inspiring project. John Snow Labs have partnered with it to sponsor the Digital Health category with the ‘Best Use of JSL Dataset’ Prize.
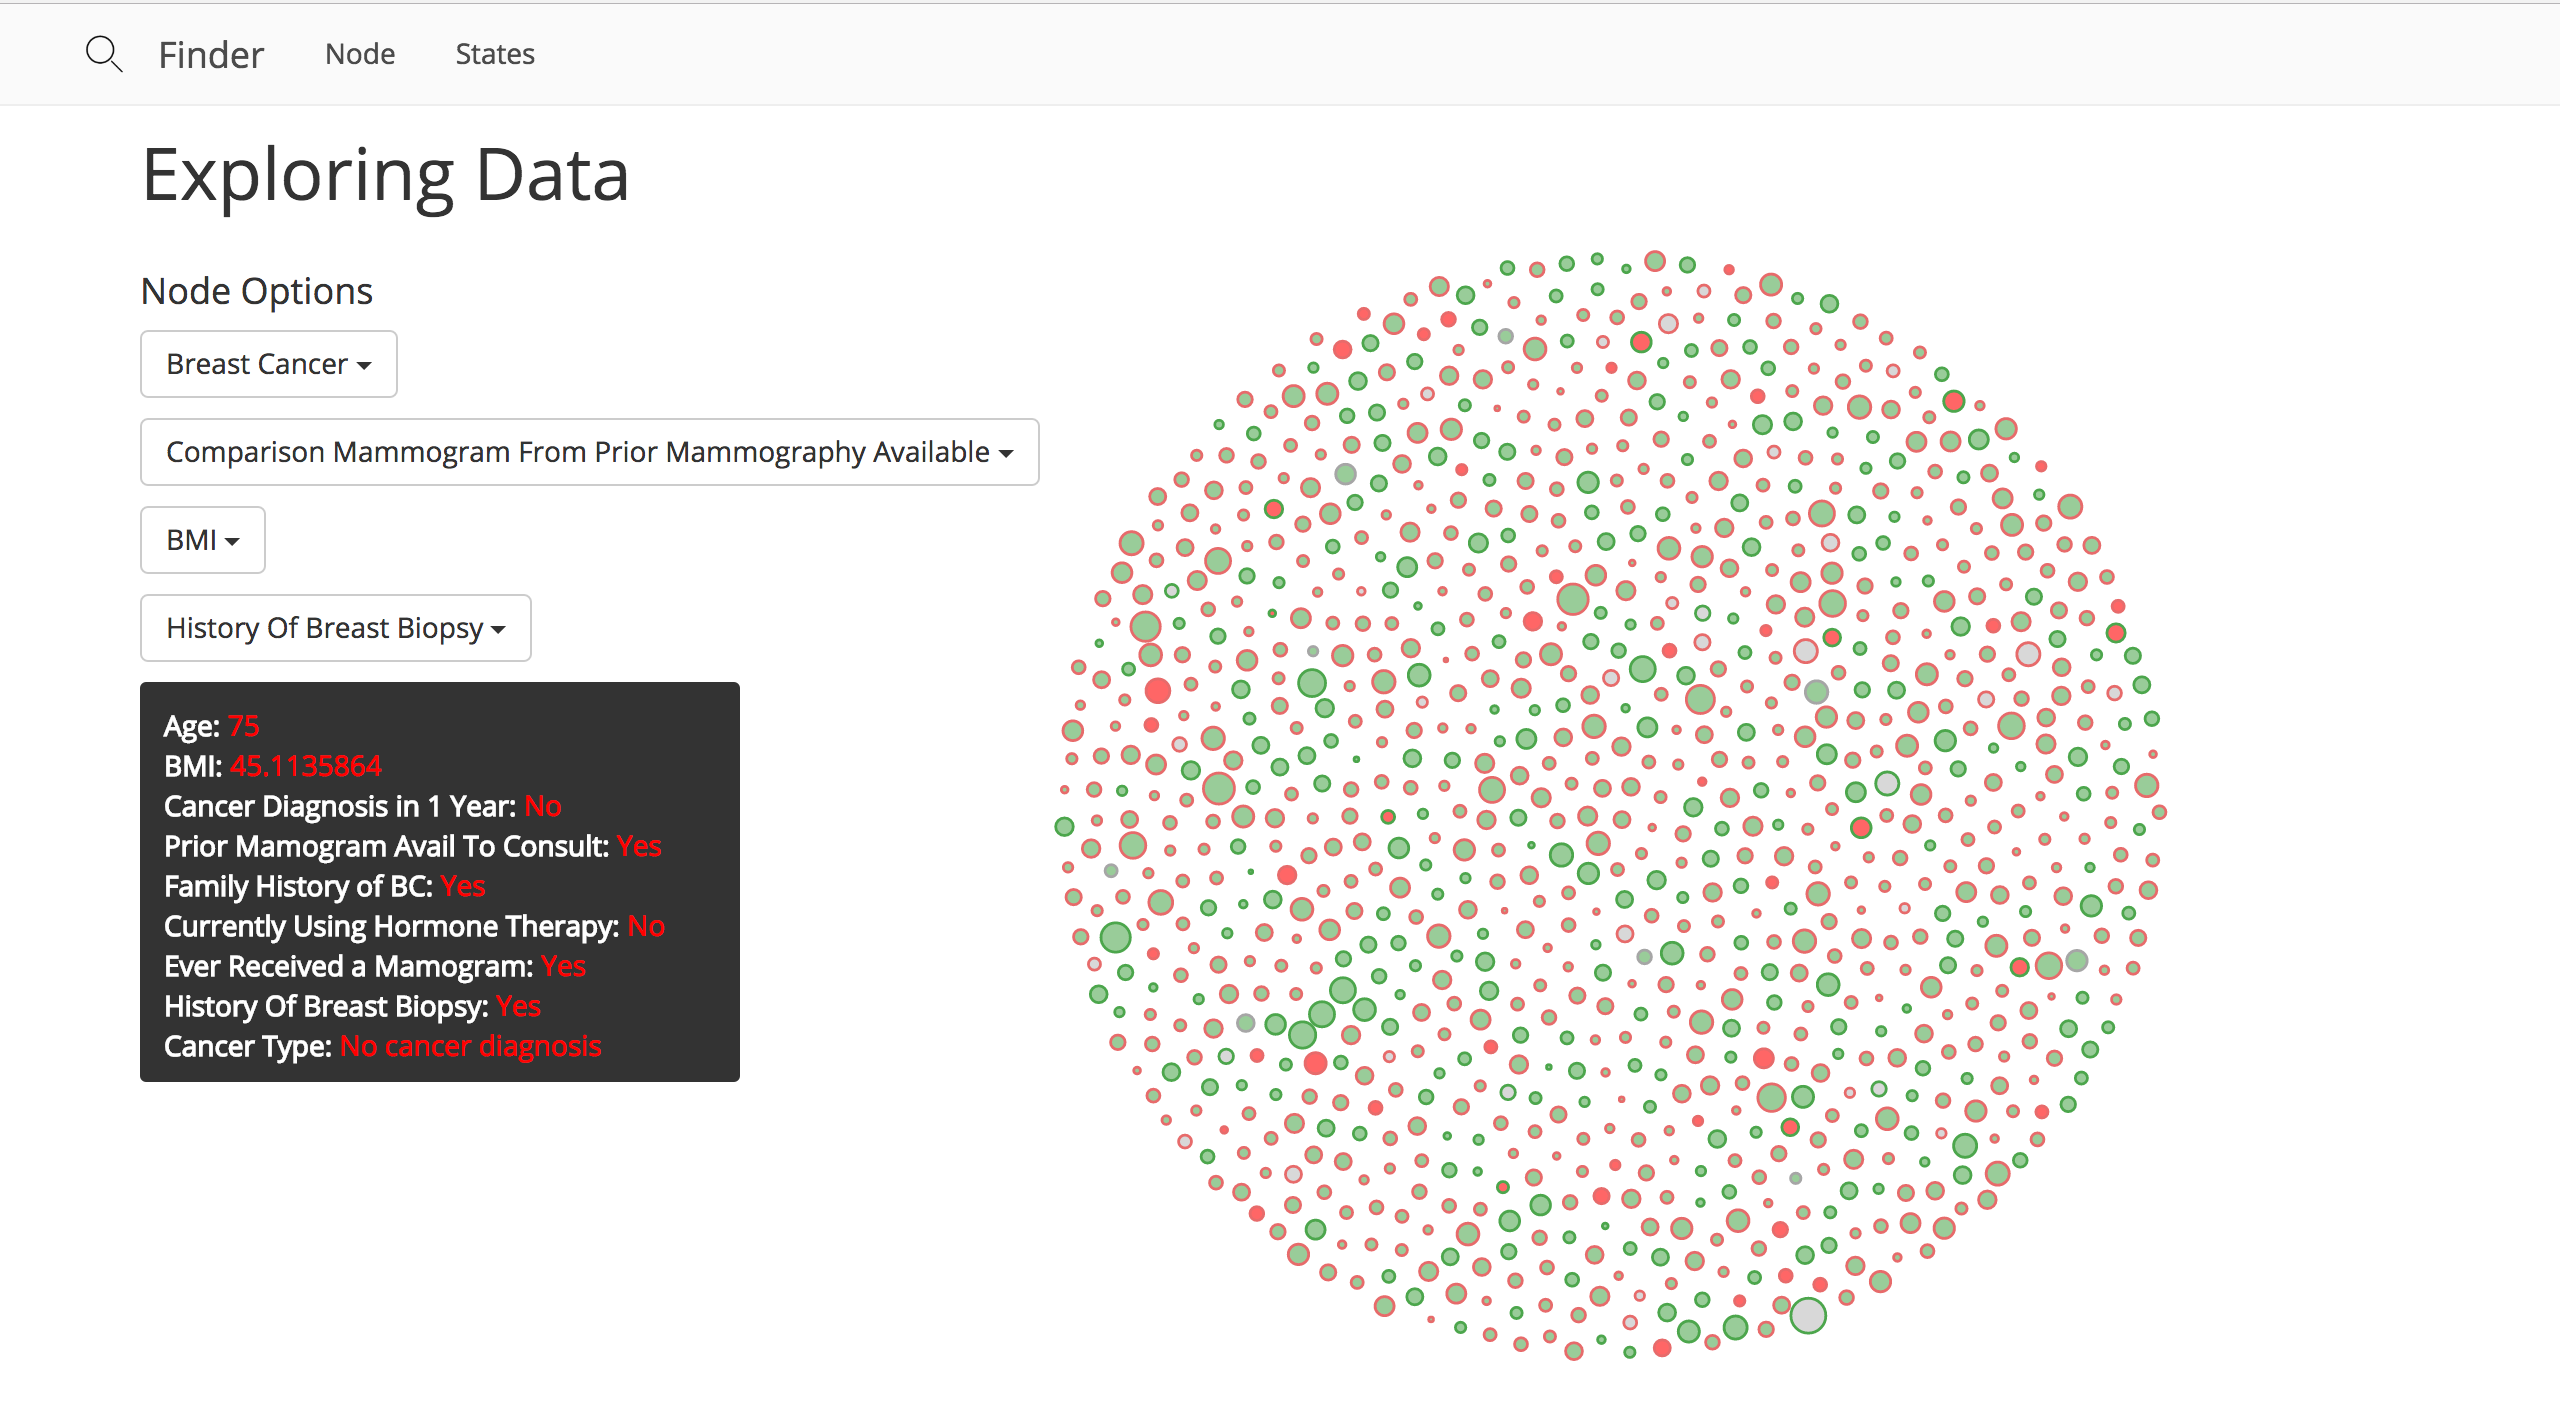
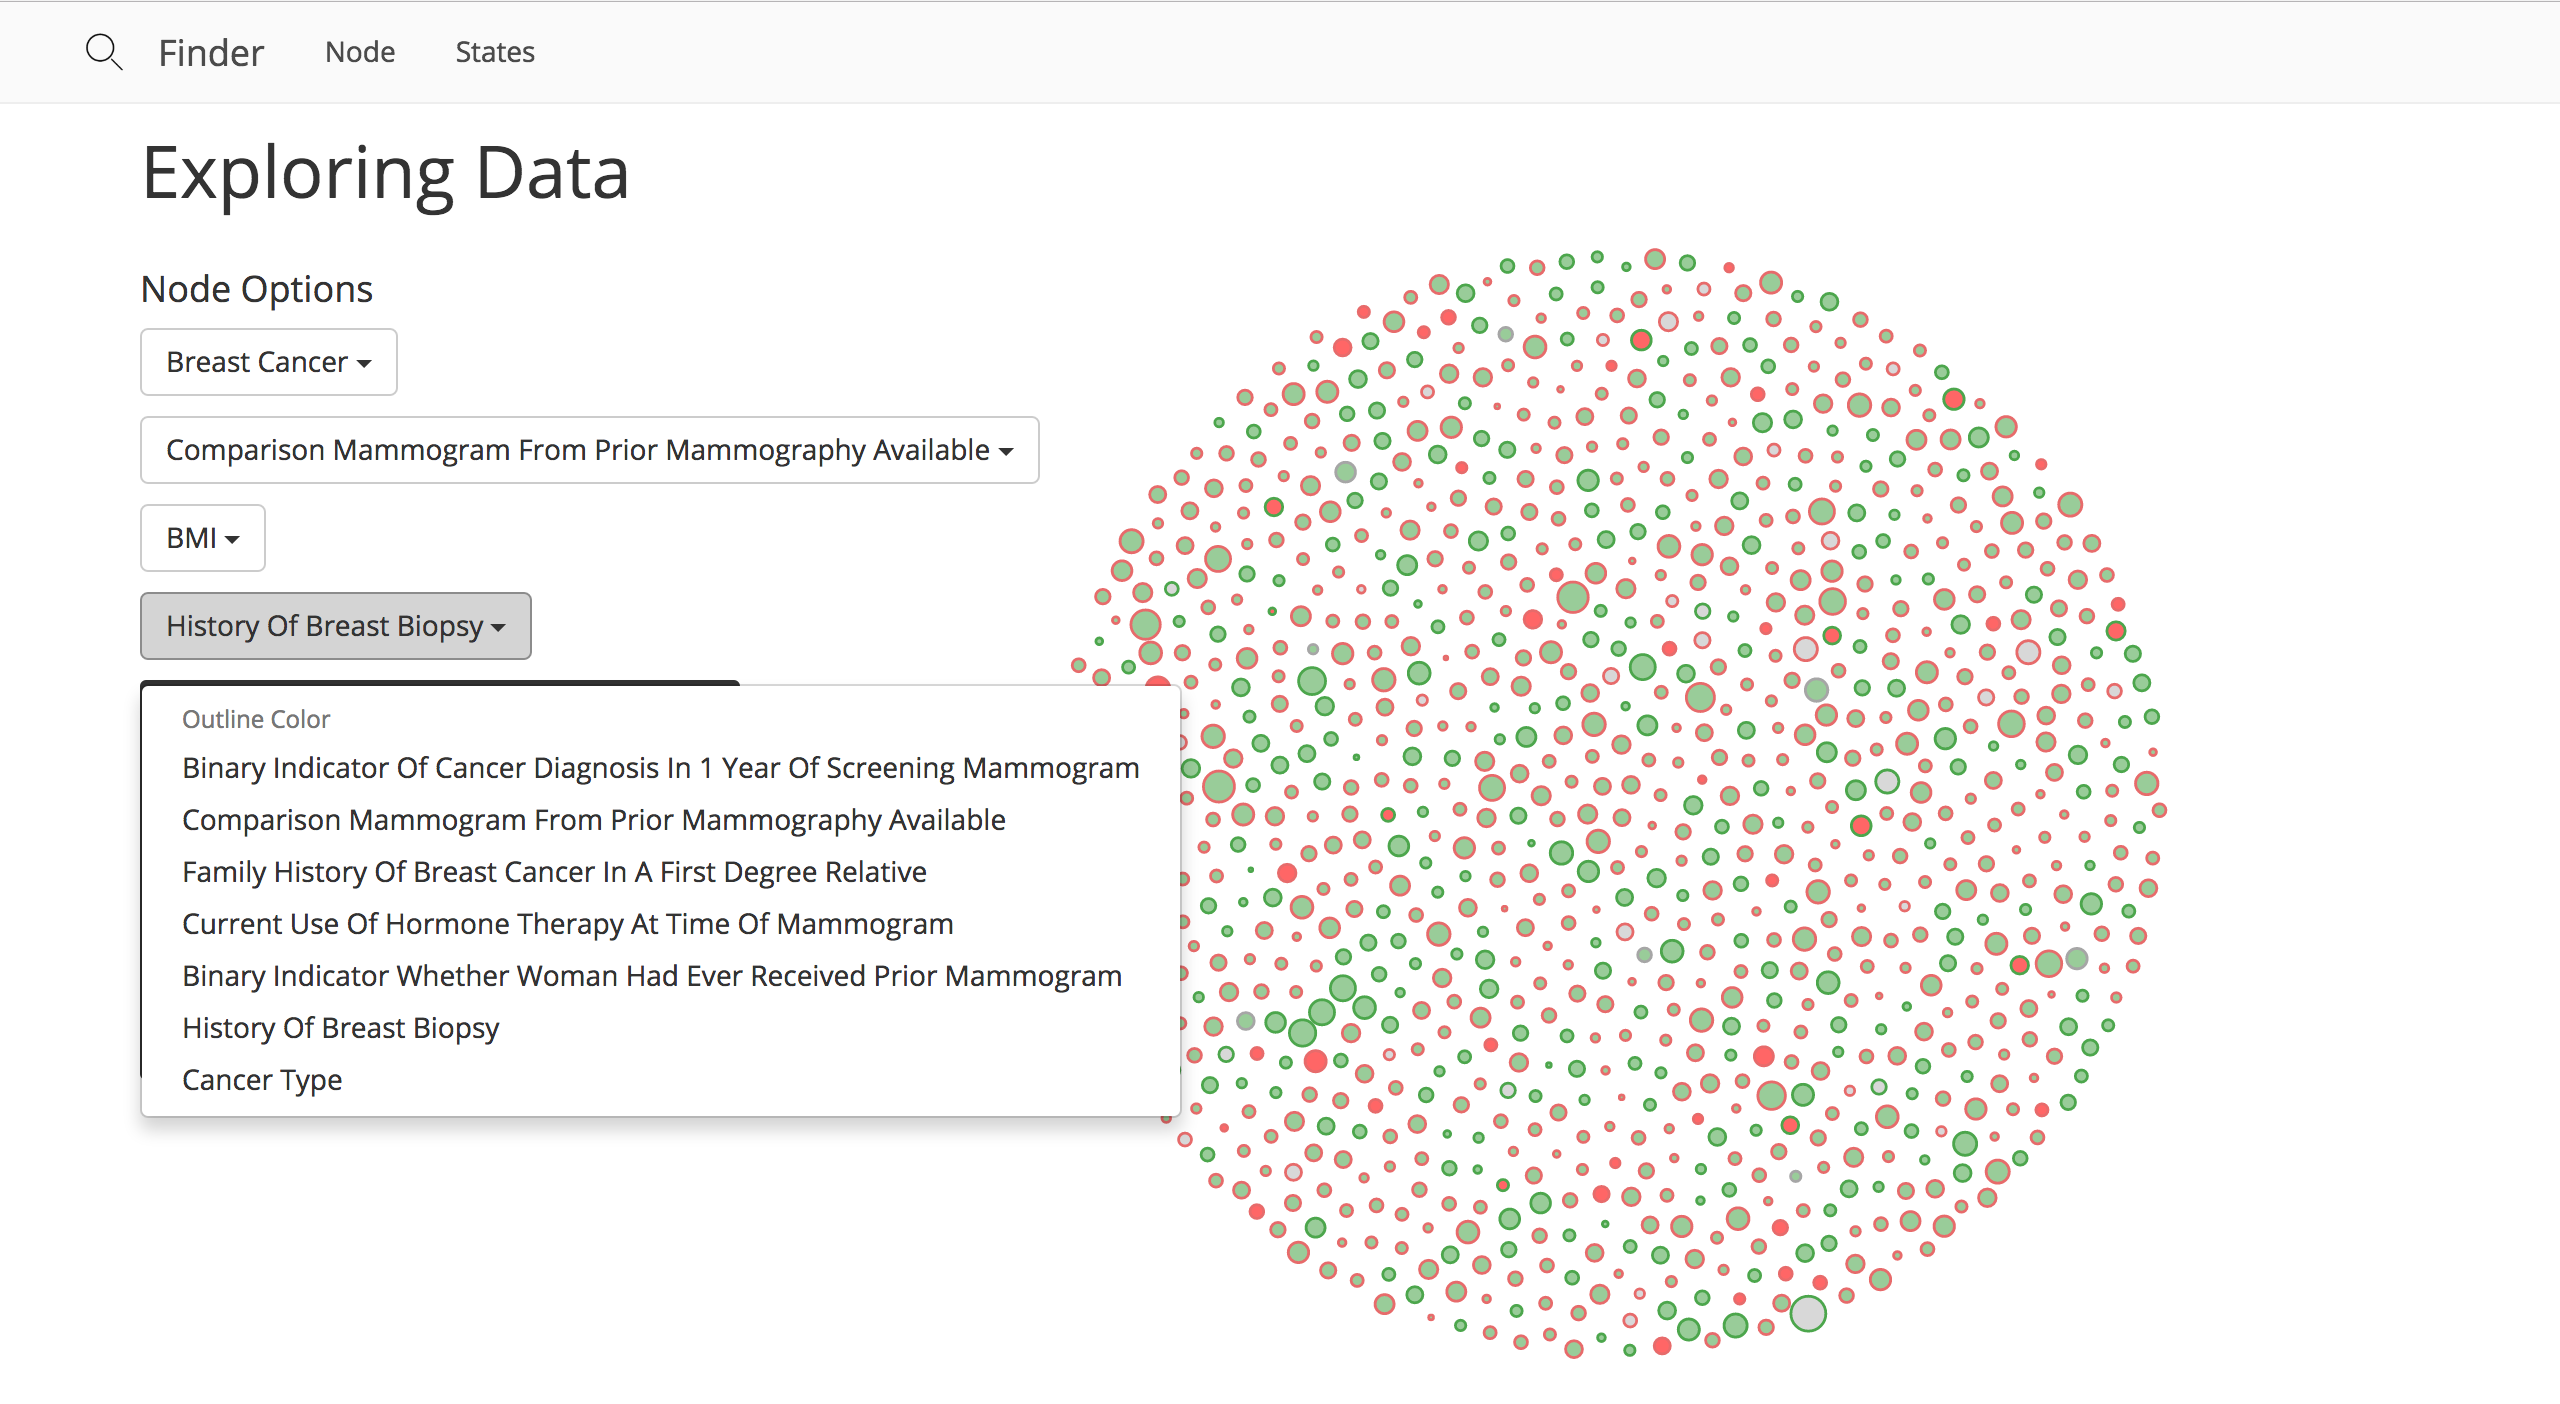
We are delighted to announce the winner “Finder”, made by Lillyan Pan. We were all very impressed with the data visualization platform she put together. Finder is a clean d3 web application that helps non-data scientists better understand health-related data.
Working with John Snow Labs’ datasets Lillyan Pan, the talented creator behind Finder, said “The datasets provided were extensive and easy to work with. The pre-cleaned data made building the application and integrating d3 much smoother. John Snow Labs had a number of interesting datasets that covered a broad range of topics.”

Inspiration
Lillyan was interested in exploring the health datasets given by John Snow Labs in order to give users the ability to explore meaningful datasets. The datasets selected were Vaccination Data Immunization Kindergarten Students 2011 to 2014, Mammography Data from Breast Cancer Surveillance Consortium, 2014 State Occupational Employment and Wage Estimate dataset from the Bureau of Labor Statistics, and Mental Health Data from the CDC and Behavioral Risk Factor Surveillance System.
Vaccinations are crucial to ending health diseases as well as deter mortality and morbidity rates and has the potential to save future generations from serious disease. By visualization the dataset, users are able to better understand the current state of vaccinations and help to create policies to improve struggling states. Mammography is equally important in preventing health risks. Mental health is an important fact in determining the well-being of a state. Similarly, the visualization allows users to better understand correlations between preventative steps and cancerous outcomes.

What it does
The data visualization allows users to observe possible impacts of preventative steps on breast cancer formation and the current state of immunizations for kindergarten students and mental health in the US. Using this data, specific state and national trends can be easily analyzed and interesting relationships they may have on one another.

How to use it
Users can select specific datasets to view, as well as specific variables from the dataset. User choices are automatically reflected in the data visualization.
How it was built
The web application’s backend used node and express. The data visualizations and data processing used d3. Specific d3 packages allowed to map and spatial visualizations using network/node analysis. D3 allowed for interactivity between the user and visualization, which allows for more sophisticated exploration of the datasets.

Challenges & Next Step
Searching through the John Snow Labs datasets required a lot of time. Further processing and finding the best way to visualize the data took much of my time as some datasets included over 40,000 entries! Working d3 also took awhile to understand.
Lillyan added “In the end, I created a working prototype that visualizes significant data that may help a user understand a complex dataset. I learned a lot more about d3 and building effective data visualizations in a very constrained amount of time.”
In the near future Lillyan hopes to add more interaction for users, such as allowing them to upload their own dataset to explore their data.
Explore how Generative AI in Healthcare is transforming data analysis, and discover how a Healthcare Chatbot can streamline access to valuable insights within John Snow Labs’ datasets.


