Introduction and definitions
The last article of our blog series dedicated to the variations observed for Medicare indicators levels at geographical level, is based, as the previous two parts, on the data available through The Physician and Other Supplier Public Use File (The Physician and Other Supplier PUF) published each year by The Centers for Medicare and Medicaid Services (CMS). As mentioned in the previous articles, the data contained in The Physician and Other Supplier PUF is for a large spectrum of variables and can be used alone or with other related data to assess the Medicare healthcare services availability, utilization and associated costs. The source of data included are the CMS administrative claims data about the beneficiaries enrolled in the Medicare fee-for-service program. In the previous two parts we covered the variations that can be observed at geographical level for indicators related to providers and the health services delivered, and indicators of the costs associated to the health services covered by Medicare program.
Medicare program, designed to offer health services financial support for elder people (65 years and above), certain younger people with disabilities and people with end-stage renal diseases (Medicare potential beneficiaries). Groups of people or individuals belonging to low income families, qualified pregnant women and children and individuals receiving Supplemental Security Income (SSI) are covered through Medicaid (Medicaid potential beneficiaries). Any person who has health care insurance through the Medicare or Medicaid programs is generally considered a beneficiary of the one or both programs.
John Snow LABS included in its library the data provided by CMS through The Physician and Other Supplier PUF and other related useful datasets, after a process of data curation and enhancement, having as purpose to accelerate the utilization and understanding this data package for the above-mentioned categories of users.
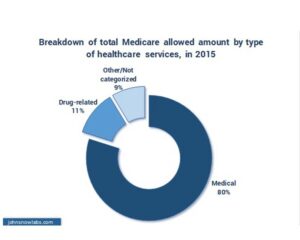
Overview on Medicare financing in 2015
The current article is offering insights for the geographical variations at state level for the Medicare beneficiaries number, personal characteristics and the CMS hierarchical condition categories (HCC) risk score variations at state level.
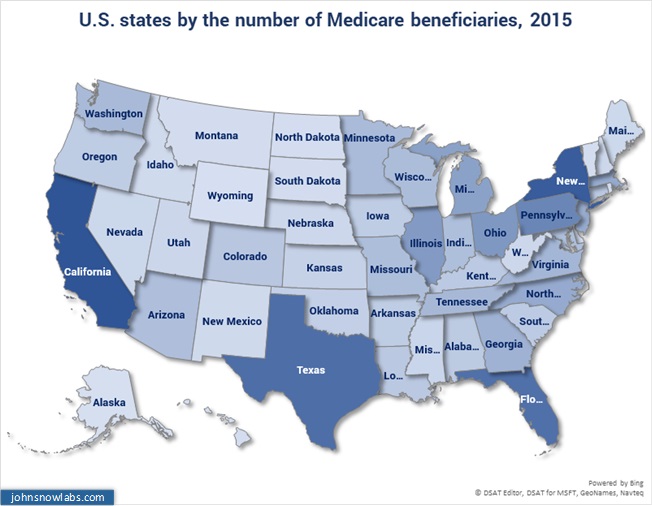
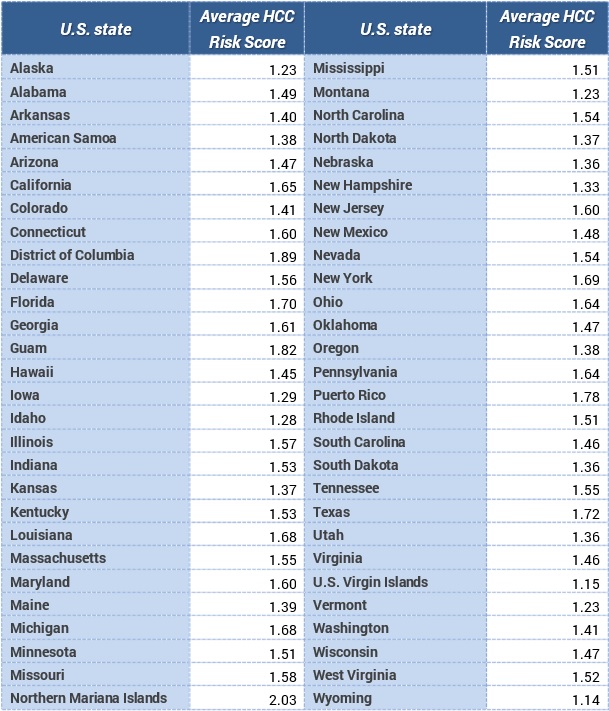
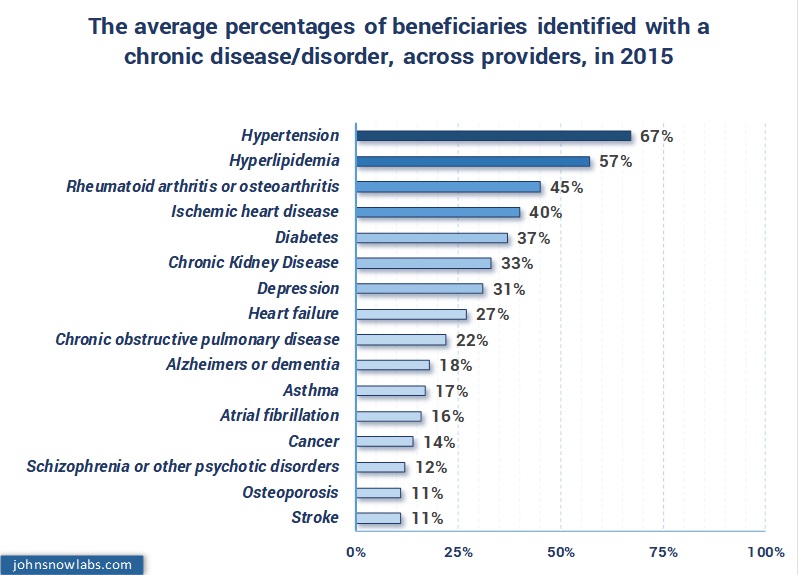
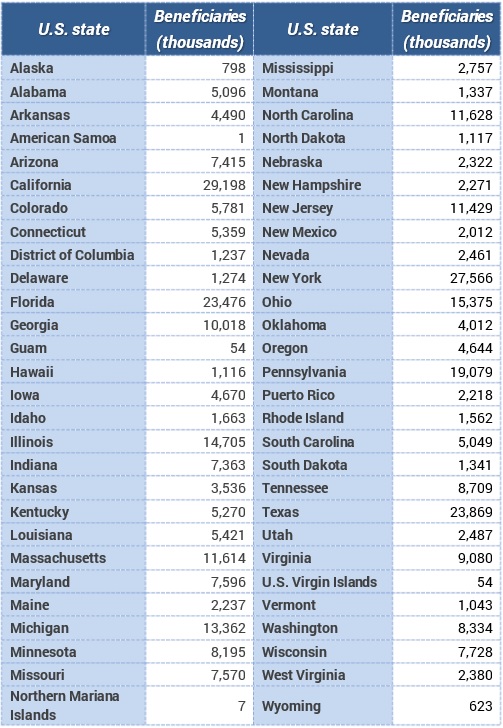
In 2015 the total number of Medicare patients was of over 350,000,000 (Medicare beneficiaries) and they received almost 3 billion healthcare services. The providers with the largest number of Medicare patients were in California, approx. 30,000 (4.4 times more than the state average of over 6.500), but the largest number of healthcare services provided was recorded in Florida, over 280,000,000 (5.6 times more than the state average of around 50,000,000). In 2015 the average HCC risk score at state level was of 1.50 and the lowest (1.47) and the highest (2.03) average risk score levels being in Wyoming and, respectively, Northern Mariana Islands. The disease/disorders found more frequently among the beneficiaries of the reporting providers (first five by frequency) were: hypertension (67%), hyperlipidaemia (57%), rheumatoid arthritis or osteoarthritis (45%), ischemic heart disease (40%) and diabetes (37%).
The beneficiaries and the average health risk
3.1 The number of Medicare beneficiaries (divided by 1,000) by states, in 2015
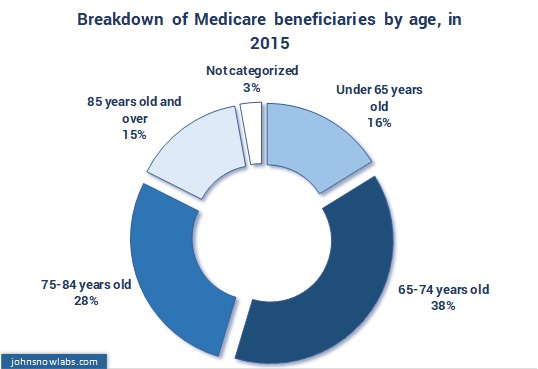
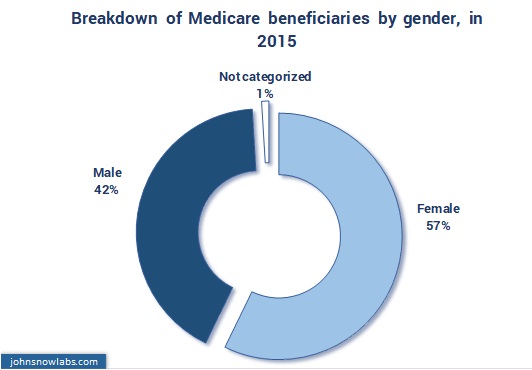
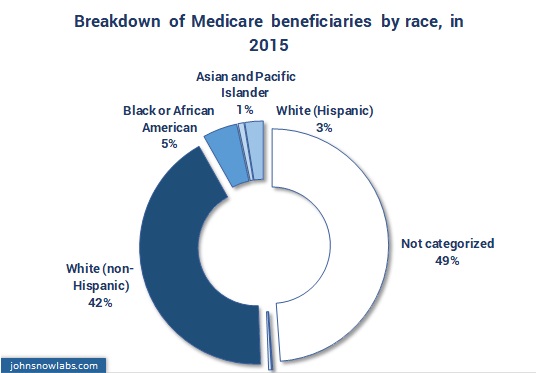
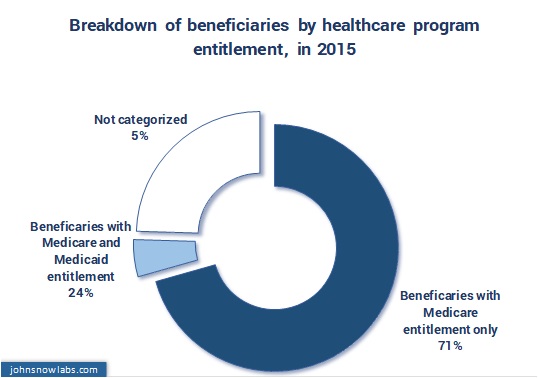
3.2 The proportions of Medicare beneficiaries by age, gender, race and healthcare program entitlement, in 2015
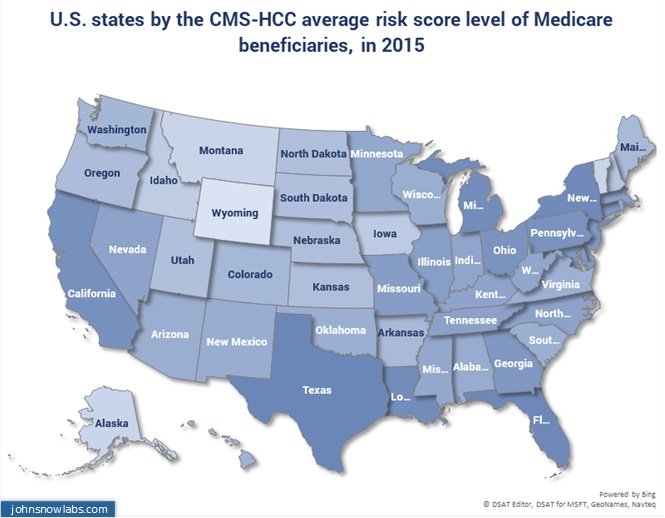
3.3 The CMS hierarchical condition categories (HCC) average risk score level of Medicare beneficiaries by state, in 2015
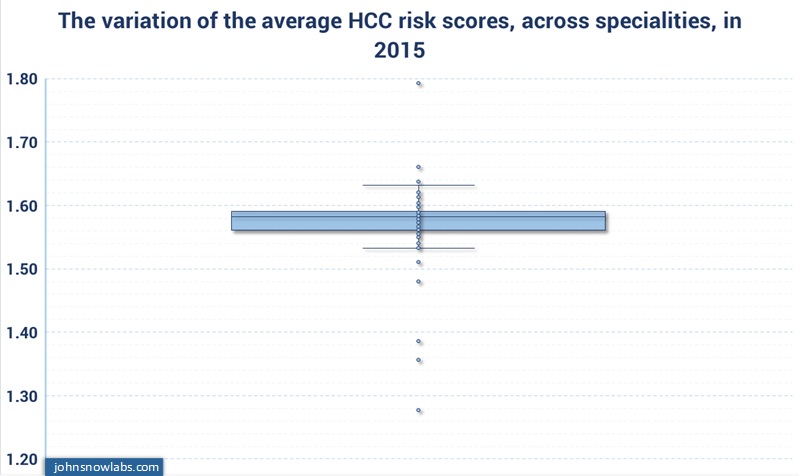
3.4 The Medicare beneficiaries CMS hierarchical condition categories (HCC) average risk score level variation across specialities, in 2015
3.5 The average percentages of beneficiaries identified with a chronic disease/disorder, across providers, in 2015
Technologies such as Generative AI in Healthcare and Healthcare Chatbot are instrumental in addressing these needs by improving patient interaction and delivering personalized healthcare solutions.


